

Brand sponsorship ROI tracking
See which sponsorships earn their renewal.
Compare what you spent with what each property delivered: impressions, reach, media value, cost per impression, and every contracted benefit with proof. One portfolio view, ready for the quarterly review and the budget meeting.
The brand demo workspace is read-only and needs no signup.
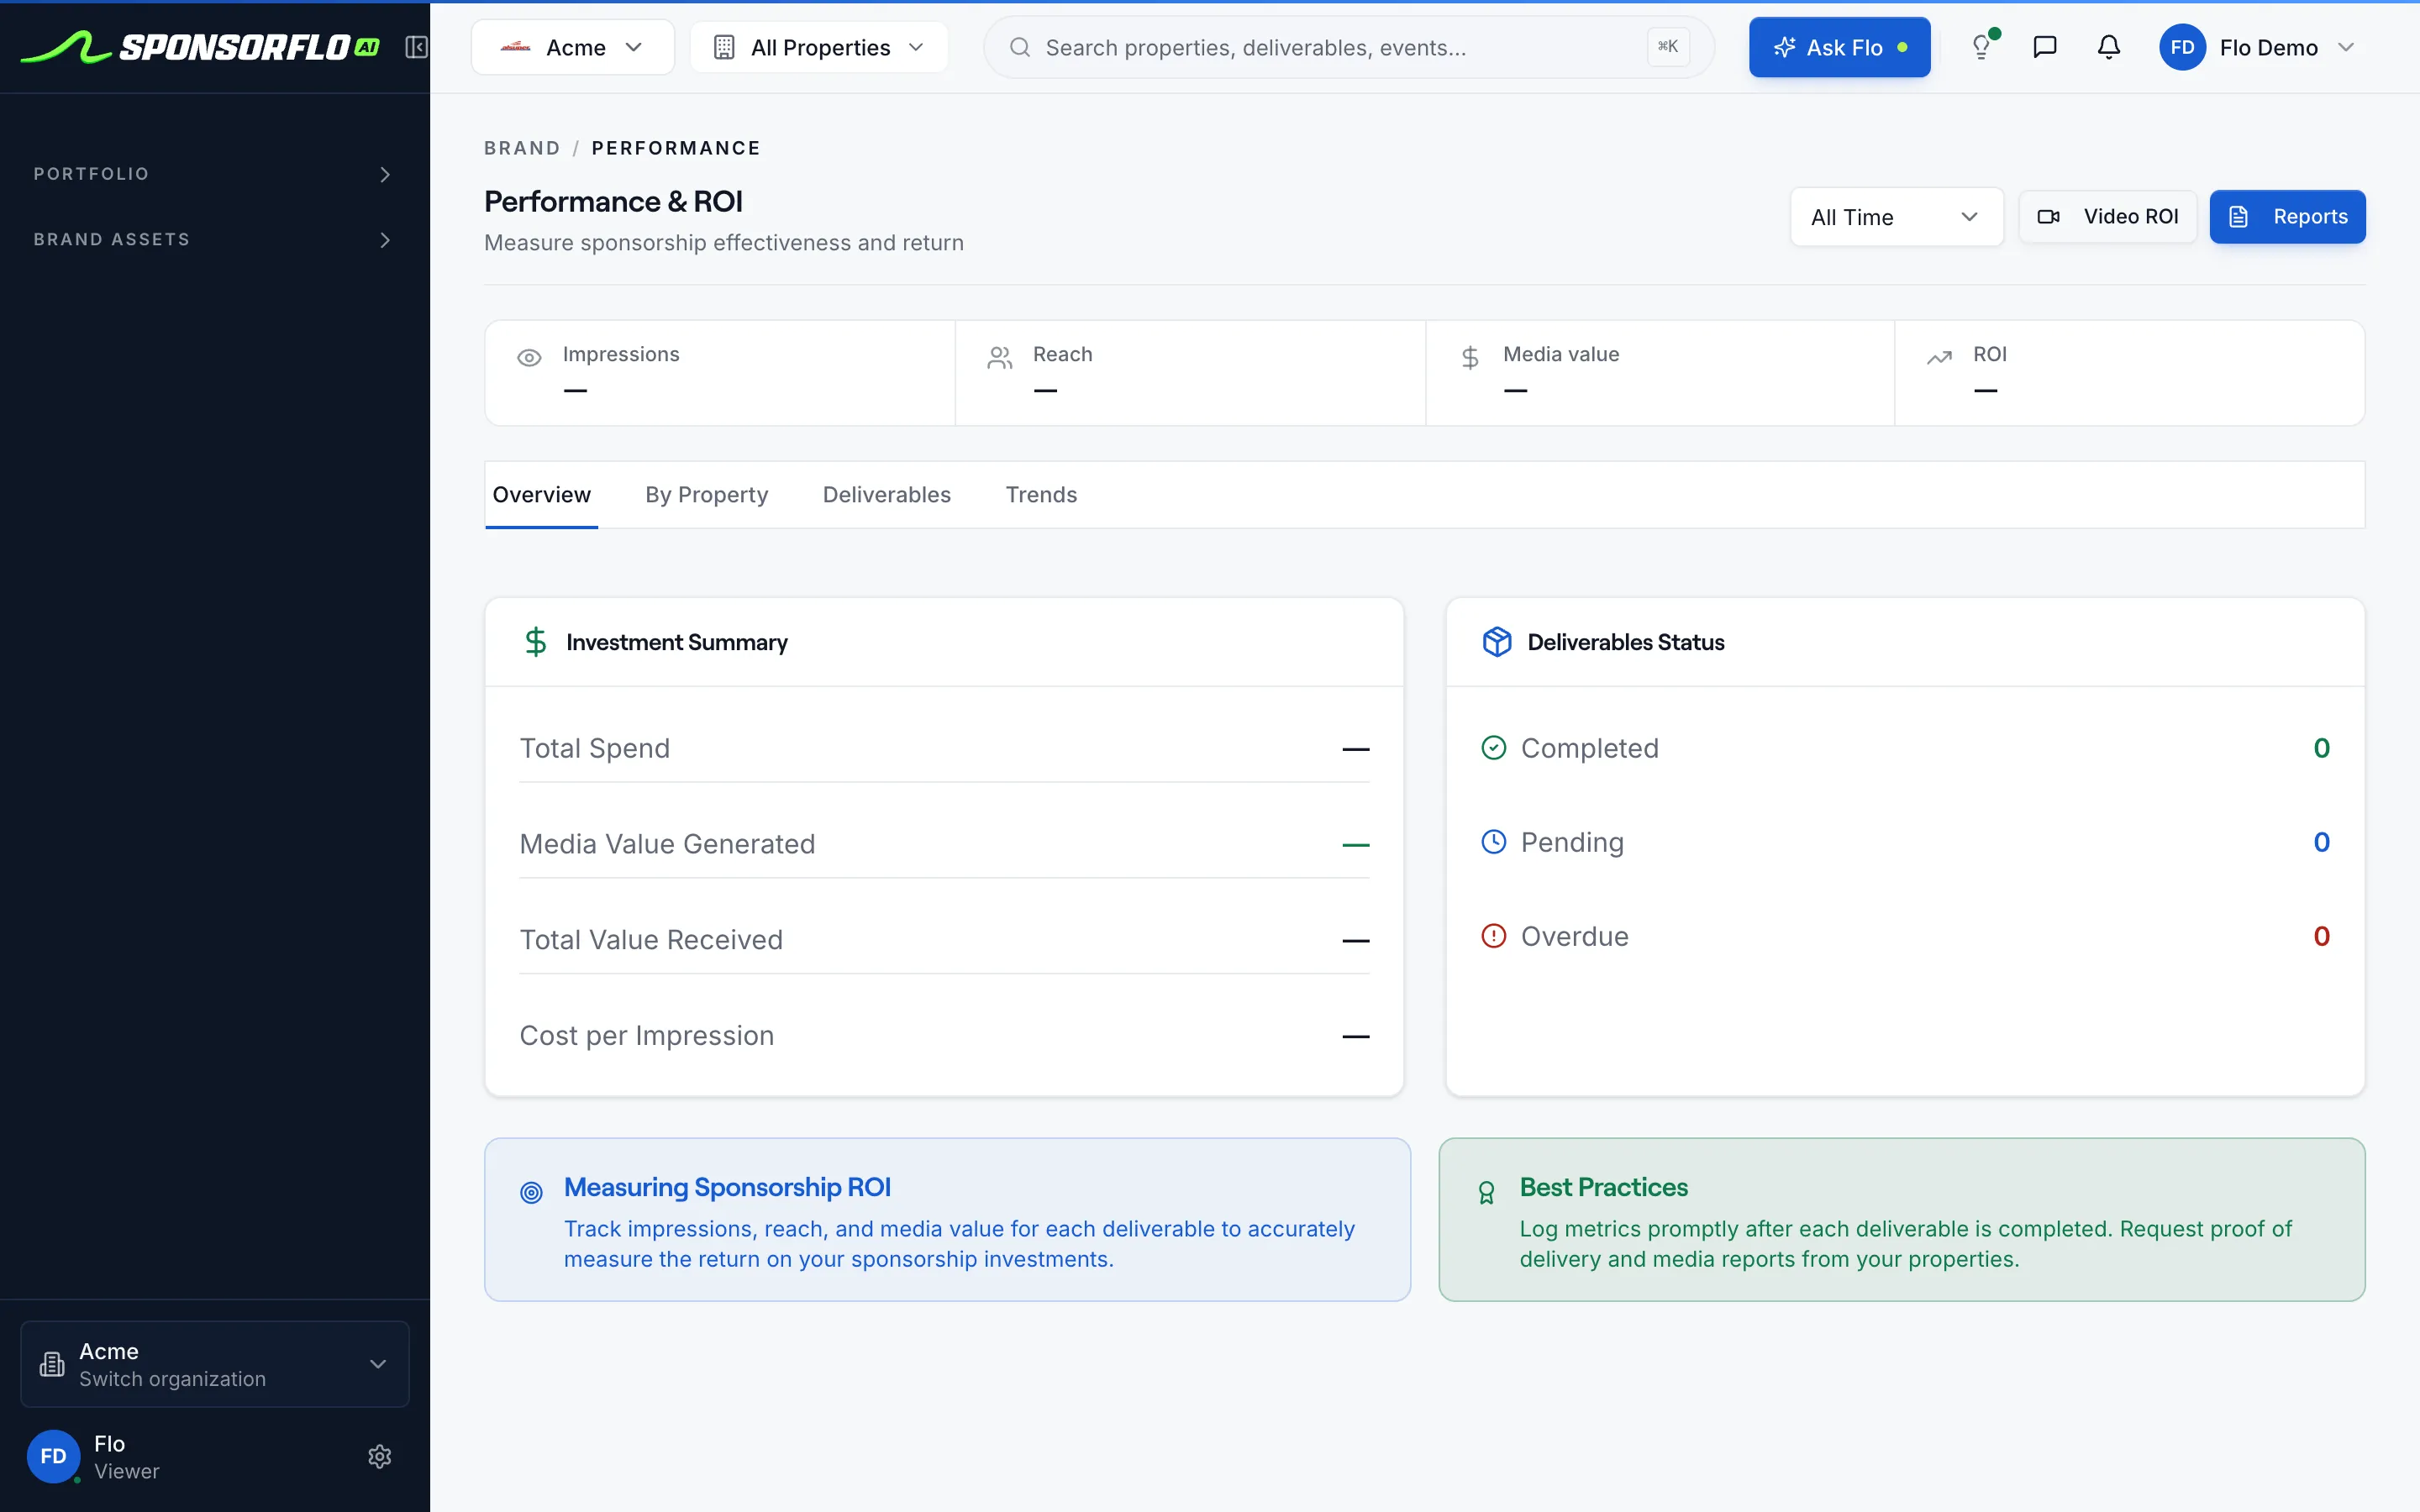
Spend next to impressions, media value, cost per impression, and deliverable completion.
Renew, renegotiate, or walk away.
Sort the portfolio by what the numbers say, not by who you like working with.
| Property | Spend | Impressions | Media value | Cost per impression | Deliverables | Next move |
|---|---|---|---|---|---|---|
| Riverside FCTitle, full season | $450K | 18.4M | $612K | $0.024 | 38 of 40 | Renew |
| The Fourth Quarter PodPresenting, 8 episodes | $48K | 2.6M | $70K | $0.018 | 16 of 16 | Renew and expand |
| Bayshore Foundation ClassicHole sponsor | $25K | 0.4M | $31K | $0.063 | 9 of 9 | Renew |
| Harborlight Music FestMain-stage banners | $120K | 3.1M | $95K | $0.039 | 14 of 18 | Renegotiate |
| Metro Esports LeagueStream overlays | $80K | 0.9M | $22K | $0.089 | 6 of 12 | Walk away |
| Portfolio | $723K | 25.4M | $830K | $0.028 | 83 of 95 |
Five numbers per property.
Each one answers a question someone will ask in the budget meeting.
Total spend
- Annual value per property
- Combined across the portfolio
Impressions and reach
- Signage, social, broadcast
- From each deliverable
Media value
- Including logo exposure
- Measured from video
Cost per impression
- Spend divided by impressions
- Same scale for every property
Completion
- Benefits fulfilled with proof
- Shortfalls documented
What to act on each quarter.
Shortfalls caught in Q2 can still be fixed. Shortfalls caught in Q4 become leverage at renewal.
- Overdue deliverables, no proofAsk the property for an update before the next review.
- High media value, low cost per impressionExpand the package or add placements at renewal.
- Renewing within 90 days with open shortfallsStart renegotiating now, not at signature.
- Video exposure beat expectationsUse it as a case study for internal budget requests.
- Portfolio cost per impression is risingCheck audience sizes and whether you pay more for the same reach.
Contract-level tracking. Pair it with a measurement firm if you need currency-grade data.
Day-to-day, contract by contract
- Deliverables and proof per property
- Video exposure tied to the contract
- Portfolio performance and renewals
Audited, market-wide
- Audited broadcast ratings
- Market-wide social benchmarks
- Data a CFO or board may require
Many brand teams use both. They are complementary, not competing.
Watch Brand HQ in action
See how a brand team scores properties, tracks rights, and stays on top of activations and renewals from one HQ view.
Exposure you measured, not exposure you assumed.
Most sponsorship value lives in video, and it is the hardest to prove. Video ROI turns a highlight reel into a number tied to the contract.
- 1Add the clipA YouTube, Instagram, TikTok, or X link, or an upload
- 2Detect the logoBrand detections counted across the footage
- 3Score itAn effectiveness score for the exposure
- 4Value itEstimated media value from what was detected
- 5Attach itThe report lands on the contracted deliverable
Questions
Evaluating a new deal? Try the sponsorship ROI calculator.
What is brand sponsorship ROI tracking?
Brand sponsorship ROI tracking is how brands measure the return on their sponsorship investments across a portfolio of teams, events, and venues. It compares what you spent with what you received: impressions, reach, media value, deliverable completion, and cost per impression. SponsorFlo’s Brand HQ gives you all of these in one Performance view.
What metrics does the Performance view show?
The Performance view shows impressions, reach, media value, ROI, total spend, cost per impression, and deliverable completion across your entire portfolio. You can see which properties delivered what they promised and where shortfalls need attention before renewal.
How does Video ROI help measure sponsorship value?
Video ROI analyzes game footage or social clips you upload or link from YouTube, Instagram, TikTok, or X. It detects your logo, counts brand detections, assigns an effectiveness score, and estimates media value, then ties that result back to the contracted deliverable as proof of performance.
Which renewals should I prioritize?
Brand HQ shows renewals coming up in the next 180 days alongside each property’s deliverable completion and performance data. Properties with strong proof and high media value relative to spend are clear renewals, while properties with open shortfalls deserve a conversation first.
How does SponsorFlo compare with Nielsen Sports, Relo Metrics, or Zoomph?
SponsorFlo measures the deliverables and video exposure tied to your contracts. When you need audited broadcast ratings or market-wide social benchmarks, measurement firms such as Nielsen Sports, Relo Metrics, or Zoomph provide those. Many brands use both: SponsorFlo for contract-level tracking and a measurement firm for currency-grade data.
Can my properties see what I track?
Properties that use SponsorFlo manage their own deliverables and attach proof through the platform. They can also share a Partner Portal link so sponsors can view deliverables and proof directly.
Brand sponsorship ROI tracking
The measurement of return on sponsorship investments from the brand’s side: total spend compared with impressions, reach, media value, cost per impression, and deliverable completion across every property the brand sponsors.
Read the full brand sponsorship ROI tracking guide
Brand sponsorship ROI tracking: how to measure what your sponsorships are worth
Brand sponsorship ROI tracking tells you whether the teams, events, and venues you sponsor are delivering the value you paid for. For a brand partnership team, that means comparing spend with impressions, reach, media value, deliverable completion, and cost per impression across your entire portfolio. SponsorFlo’s Brand HQ puts all of those numbers in one Performance view, built from the properties, deliverables, and proof your team already manages, so every quarterly review and renewal conversation starts with evidence instead of guesswork.
What should brands track in sponsorship ROI?
Track the numbers that tell you whether to renew, renegotiate, or walk away. Most brand partnership teams need five metrics for each property they sponsor, plus a portfolio-level roll-up that shows where the budget is working hardest.
- Total spend: the annual value of each sponsorship and the combined spend across your portfolio.
- Impressions and reach: the audience each property delivered through signage, social posts, broadcast mentions, and other contracted benefits.
- Media value: the estimated value of the exposure each sponsor placement generated, including logo detections measured from video.
- Cost per impression: your spend divided by total impressions, so you can compare properties on the same scale.
- Deliverable completion: how many contracted benefits each property fulfilled, with proof attached to each one.
How do you measure brand sponsorship ROI?
Sponsorship ROI compares what you paid with the value you received. A straightforward process that you can defend in a budget meeting looks like this:
- Add each property to Brand HQ with its annual value, term dates, and every deliverable the contract promises.
- As each deliverable runs, the property attaches proof: a photo of the jersey patch, a link to the social post, a clip of the in-venue signage.
- Upload game footage or social video to Video ROI. It detects your logo, counts brand detections, assigns an effectiveness score, and estimates media value.
- Open the Performance view to see impressions, reach, media value, ROI, total spend, and cost per impression across your portfolio.
- Carry the numbers into the renewal conversation, with any shortfalls clearly documented.
What does the Brand HQ Performance view show?
The Performance view in Brand HQ shows impressions, reach, media value, ROI, total spend, cost per impression, and deliverable completion across every property you sponsor. A partnership manager can see at a glance which properties are delivering strong value relative to spend and which have gaps that need attention. For example, if you sponsor a minor league baseball team for signage behind home plate and a podcast read before every episode, you can compare the media value from detected logo exposure in broadcast clips against the cost of that deal, alongside every other property in your book.
How does video help prove sponsorship value?
Video is where most sponsorship value lives, but it is also the hardest to quantify without a tool. SponsorFlo’s Video ROI analyzes a YouTube, Instagram, TikTok, or X URL, or a file you upload directly. It detects your logo in the footage, reports brand detections and an effectiveness score, estimates media value, and lets you export the result as a report. That report ties back to the contracted deliverable, so the proof is attached to the benefit rather than floating in a separate folder. A brand that sponsors a basketball team’s courtside LED board, for example, can upload a game highlight reel and see exactly how many seconds the logo appeared, what media value that exposure represents, and how it compares to what the contract cost.
How to build a renewal shortlist from your portfolio
Brand HQ shows which sponsorships come up for renewal in the next 180 days. A renewal shortlist built from performance data is far stronger than one built from memory or relationship alone. Start by separating your properties into three groups:
- Renew: properties with full proof on their critical deliverables, strong media value relative to spend, and a low cost per impression.
- Renegotiate: properties with partial proof or shortfalls on key deliverables, where the relationship is worth keeping but the package needs adjustment.
- Walk away: properties where deliverables consistently missed, media value was low relative to spend, or the audience no longer aligns with your brand.
Starting the renewal conversation a few months before the term ends gives both sides time to adjust. A property that sees its shortfalls documented clearly may offer a make-good or a revised package, which is a better outcome than discovering problems after the contract auto-renews.
Using quarterly reviews to keep sponsorships on track
A quarterly review that starts with the Performance view takes the guesswork out of the meeting. Open Brand HQ, filter to the quarter, and look at three things: which deliverables ran and have proof attached, which are overdue or missing proof, and how the media value compares with what you budgeted. For a brand sponsoring a music festival, that might mean checking whether the booth activation photos came in, whether the logo appeared in the recap video, and whether the social mentions hit the promised impression count. Shortfalls caught in Q2 can be fixed before the festival ends, while shortfalls caught in Q4 become leverage in a renewal negotiation.
How SponsorFlo compares with sponsorship measurement firms
SponsorFlo tracks the deliverables, proof, and video exposure tied to your contracts. When you need audited broadcast ratings or market-wide social benchmarks, measurement firms such as Nielsen Sports, Relo Metrics, or Zoomph provide those. Many brand teams use both: SponsorFlo for day-to-day contract tracking and portfolio performance, and a measurement firm for the currency-grade data that satisfies a CFO or a board. The two are complementary rather than competing.
Signals worth acting on each quarter
- A property with overdue deliverables and no proof attached: reach out now and ask for an update before the next review.
- A property with high media value and low cost per impression: consider expanding the package or adding new placements at renewal.
- A sponsorship renewing in the next 90 days with open shortfalls: start the renegotiation conversation immediately.
- A property where video exposure exceeded expectations: use that result as a case study for internal budget requests.
- A portfolio-wide cost per impression that is rising: review whether audience sizes have shifted or whether you are paying more for the same reach.
- Brand HQ portfolio — manage every property you sponsor in one dashboard
- Brand deliverables — track proof of performance for every contracted benefit
- Video ROI analysis — detect sponsor logos in footage and estimate media value
- Sponsorship analytics — pipeline, engagement, and fulfillment for sponsorship sellers
Related features and solutions
Brand HQ portfolio
Manage every property you sponsor in one dashboard
Learn moreSolutionBrand deliverables
Track proof of performance for every contracted benefit
Learn moreFeatureVideo ROI analysis
Detect sponsor logos in footage and estimate media value
Learn moreFeatureSponsorship analytics
Pipeline, engagement, and fulfillment for sponsorship sellers
Learn moreWalk into the budget meeting with the numbers.
Open the brand demo workspace to see spend, media value, and completion across a real portfolio.